Unlock the full potential of Power BI with our Advanced Power BI course!
Dive deep into
- Advanced DAX measures.
- Explore sophisticated use cases for Power Query.
- Master data visualization using advanced settings.
Learn to implement row-level security, keep your data models optimized, and import custom visuals.
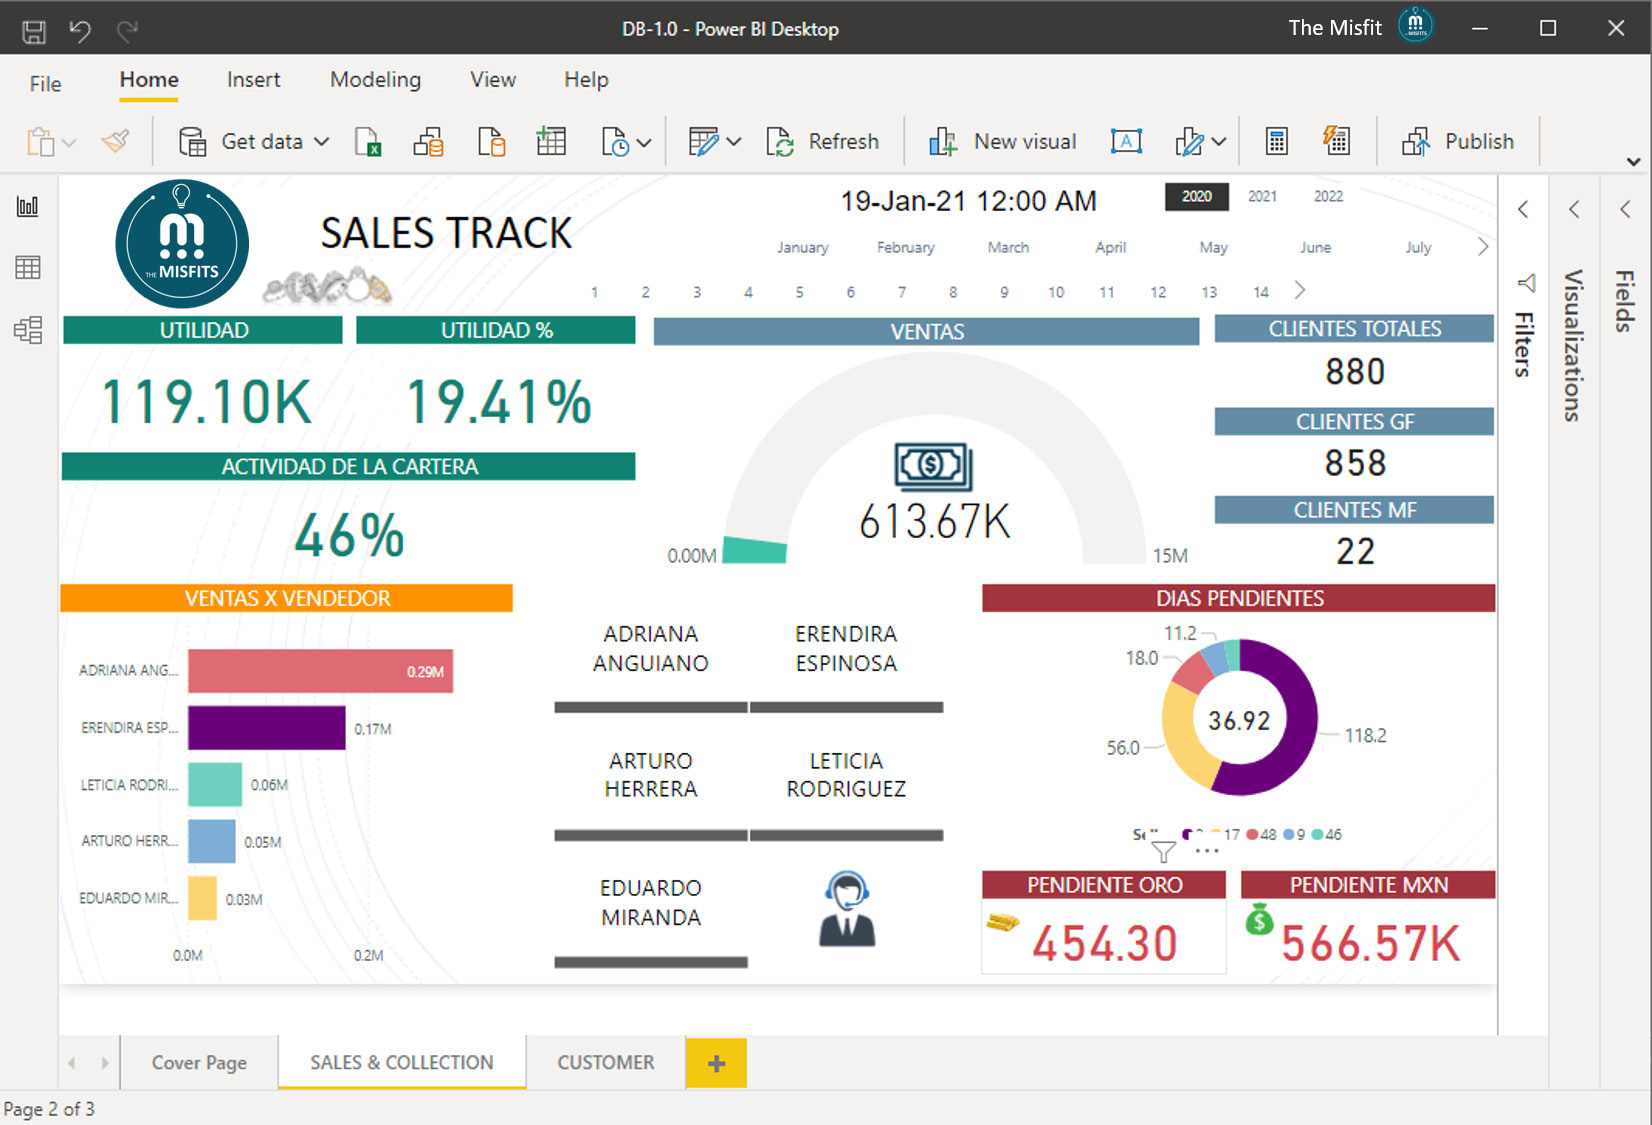
Enhance your reports with Python or R visuals, and leverage new KPI cards, Gauges, and more to create Stellar Dashboards for your management.
This comprehensive two-day Advanced Power BI course in Singapore is designed for those who already know the basics of Power BI and are ready to elevate their skills to the next level.
Learn From Power BI Experts
Led by Power BI Guru Vinai Prakash, with over 35 years of experience in data analysis and business intelligence, this course promises hands-on, practical learning to empower you with advanced skills.
This course is perfect for:
- Business analysts and data professionals who have a basic understanding of Power BI.
- Professionals looking to enhance their data visualization and analysis skills.
- Individuals seeking to implement advanced Power BI features in their work.
- Anyone interested in taking their Power BI knowledge to an intermediate or advanced level.

ACTA Certified Trainers

Authorized Training Organization

WSQ
Certifications
Fully Set Up
Training Room

20+ Years
Experience in Education

Practical, Hands-on
Training

25,000+
Certified Students

32+
Courses

Useful & Handy
Student Guide