Data Analytics & Visualization with Power BI: WSQ Funded

WSQ Funded Power BI Course in Singapore

What Will Your Learn in Power BI MasterClass?

  • Build professional-quality business intelligence reports from the ground up
  • Blend and transform raw data into beautiful interactive dashboards
  • Design and implement the same B.I. tools used by professional analysts and data scientists
  • Learn Power Query, Power Pivot, DAX Measures, Data Visualizations, Publishing to Power BI Online Services.
  • Showcase your skills with a full-scale course project (with step-by-step solutions)
  • Understand the business intelligence workflow from end-to-end
  • Learn from a Power BI Guru instructor and professional BI developer

Training Course Fees

The full course fees for this training is S$1,000, before any Government funding.
For Singaporean/PR above 21 years, Training Grants are available.
For Foreigners, no government grants are available.

Grant Information

WSQ funding from SkillsFuture Singapore (SSG) is available to Singaporeans/PRs above 21.
(Both Individuals & Company Sponsored ).

Individual Singaporeans, 25 years & above can also use their SkillsFuture Credits for this training at Intellisoft.

Companies sending Locals & Foreign staff for training can avail SFEC Funding. 
Use it to improve the skills of your entire department!

NTUC Members can utilize UTAP Funds to offset 50% of the remaining fees*.

Contact us for more information on How to apply for this SkillsFuture Grant.
Call +65-6252-5033 for Details or WhatsApp Now at +65-9066-9991

up to 70% Grant

$700 Funding by SSG
Pay $300
  • Singaporeans Above 40 Years
  • Individuals
  • SME Companies
  • Individuals Can Use SkillsFuture
  • UTAP Funding*

up to 50% Grant

$500 Funding by SSG
Pay $500
  • Below 40 Years
  • Individuals
  • SG / PR / MNC Companies
  • SkillsFuture (Singaporeans only)
  • UTAP Funding*

Course Overview

Organizations rely on data for critical decision-making to gain valuable insights to guide their strategic direction.WSQ Power BI Course Singapore

Analysis helps companies decide on which new products to develop, identify investment opportunities, recognize new markets to enter, and better engage with their customers.

However, they are overwhelmed with too much data. Unsure about where and how to begin, they miss the opportunities for lack of timely analysis and insights.

This is why data analytics skills are in high demand as companies try to make sense of the massive amount of data available.

Through data analytics, management will also be able to make decisions quicker and more efficiently.

Course Outline

The Power BI Data Visualization course is focused on understanding how to load and prepare the data, build a data model, and then apply data analysis techniques to design effective reports that will enable the business to visualize the information quickly. This is a fantastic way to analyse and visualize data properly in one go and save time.

Microsoft POWER BI is the MARKET LEADER in BUSINESS INTELLIGENCE industry.

This course is divided into 3 major sections: PLAN Stage, DO Stage, and the Check & Act Stage.

SECTION 1: Load & Prepare Data Model

Lesson 1: Introduction to Power Platform

  • Emerging Visualization Tools & Business Needs
  • Power Query, Power Pivot & Power BI

Lesson 2: Data Analysis & Visualization Process Explained

  • Principles of Data Modelling
  • Principles of Data Visualization
  • Data Analysis & Visualization Process

Lesson 3: Introduction to Power Query

  • Load Data from Excel Files
  • Load Data from Text Files & Folders
  • Load Data from Databases
  • Load Data from Other Sources
  • Data Cleansing Tips & Troubleshooting
  • Creating a Data Model

SECTION 2: Visualize Data With Power BI Tools

Lesson 4: Introduction to DAX

  • Summary Measures
  • Calculated Columns
  • Calendar Functions

Lesson 5: Introduction to Power BI Visualizations

  • Tables & Matrix
  • Bar & Column Charts
  • Styling Options
  • Conditional Formatting

Lesson 6: Advanced Data Visualization & Scorecards

  • Maps
  • Gauge
  • Styling Options
  • KPI
  • Cards

SECTION 3: Present & Share Insights in Power BI Dashboards

Lesson 7: Create a data-driven story with Power BI reports

  • Filters
  • Connected Slicers
  • Bookmarks
  • Address Answers to Key Questions
  • Strategic visualization and mapping techniques

Lesson 8: Publish a Power BI Report

  • Enhance Power BI report designs for the user experience
  • Share, Export, and Mobile Views

Target Audience

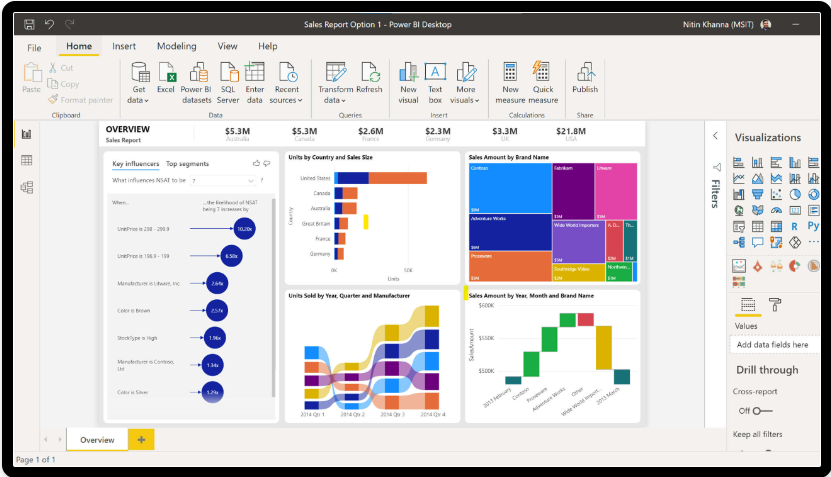
This Data Visualization training is helpful for Data Analysts, Bankers, Finance and Accounting Executives, Sales, Manufacturing &Power BI on tablet - course in Singapore Service professionals who deal with a large amount of data and want to change these into actionable information presented in Power BI Dashboards with Tables, Charts & Visualizations.

Data analysts can use the knowledge and skills learned to derive complex performance analyses for actions to be taken.

Business users can also use the learnings to observe changes in data patterns to gain insights into the performance of their investments in marketing, sales, and advertising.

All industry verticals with functions in Information Technology, Accounting, Finance & Service would benefit immensely from using Power BI to understand and interpret data quickly and visualize it through invaluable charts and dashboards.

This Data Visualization With Power BI Training is suitable for beginners. But it is good if you have basic experience in using Microsoft Excel.

We target this training towards people who rely on manual methods or Microsoft Excel for reporting and analysis and are searching for better analysis and visualization tools.

Pre-Requisites

It would be good if you have Basic knowledge of Excel and can write simple formulas like SUM, IF and a passion for acquiring Data Analysis Superpowers

Anyone with Database, BI, Programming, or similar experience are pretty qualified to take this course, even if lacking in Excel experience.

Microsoft POWER BI Desktop software is available for download from the Microsoft website for free. We will provide you with a copy of the application for use in the class.

Grant Information

WSQ: To claim WSQ Funding for this Data Analytics & Visualization with Power BI course, participants must be either individual Singaporeans/PRs, OR Company Sponsored Singaporeans/PRs. You can get up to 50% to 70% WSQ Grant.

SkillsFuture for Microsoft Power BI Training: Individual Singaporeans aged 25 and above can use their SkillsFuture Credits to offset the unfunded portion to learn how to use Power BI for data analytics and visualization.

UTAP Funding: NTUC Members can utilize UTAP to offset 50% of the remaining fees*.

Call us at +65 6250-3575 or email to training@intellisoft.com.sg for any questions or to register for the upcoming class of Data Analytics & Visualization with Power BI with Skillsfuture or WSQ funding.

Do You Have Any Questions

on Course Fee, WSQ Grant or Funding?

Ask Us. We’ll be happy to assist you.

Register

How To Register For Data Analytics & Data Visualization With Power BI MasterClass Course in Singapore

Register for the 2 Days Power BI MasterClass Course today by simply clicking on the chosen course date available at the top of this page.

Need Help?
Call us at +65-6250-3575, SMS / WhatsApp: 9066-9991

Send an email to training@intellisoft.com.sg

We have regular public classes For Power BI Training each month, and Corporate Training can be arranged at your office too!

Note: This class uses a  very practical and hands-on approach to gain Power BI Mastery. It requires you to take part in Data Analysis & Data Visualization exercises during the class.

You can bring your own laptop or request to use our laptop during the class beforehand.

WSQ Funded Data Analytics and Visualization With Microsoft Power BI Training: 

Join today, and begin to Master Power BI with our Step-by-step instructions and helpful, patient, Microsoft Certified Trainers to guide you.

What are you waiting for? Get Started Right away…

Why Choose Us?

ACTA Certified Trainers

Authorized Training Organization

WSQ
Certifications

Fully Set Up
Training Room

20+ Years
Experience in Education

Practical, Hands-on
Training

25,000+
Certified Students

32+
Courses

Useful & Handy
Student Guide

Contact Us

We are located at Fortune Centre, 190 Middle Road, #10-08 Singapore 188979

Click here for For Directions 

Telephone: 6252-5033  WhatsApp: 9066-9991

Email: info@trainingint.com

Advanced Power BI Course with WSQ Certification from SSG. 70% Grant

Free Training on Data Analytics with Excel & Power BI

Signup & Learn How to Analyze data using Excel & Power BI
Pick Data Analysis Tips For Free

Start Saving Today

Get the 8 Tips to Start Saving on Your Website Design
PDF Guide emailed to you now.

Save Money on Website Design Guide