Intellisoft Training: WSQ Funded IT Training in Singapore
Upgrade Skills With WSQ & SkillsFuture Funding from Singapore Government

WSQ Grant of up to 50-70%
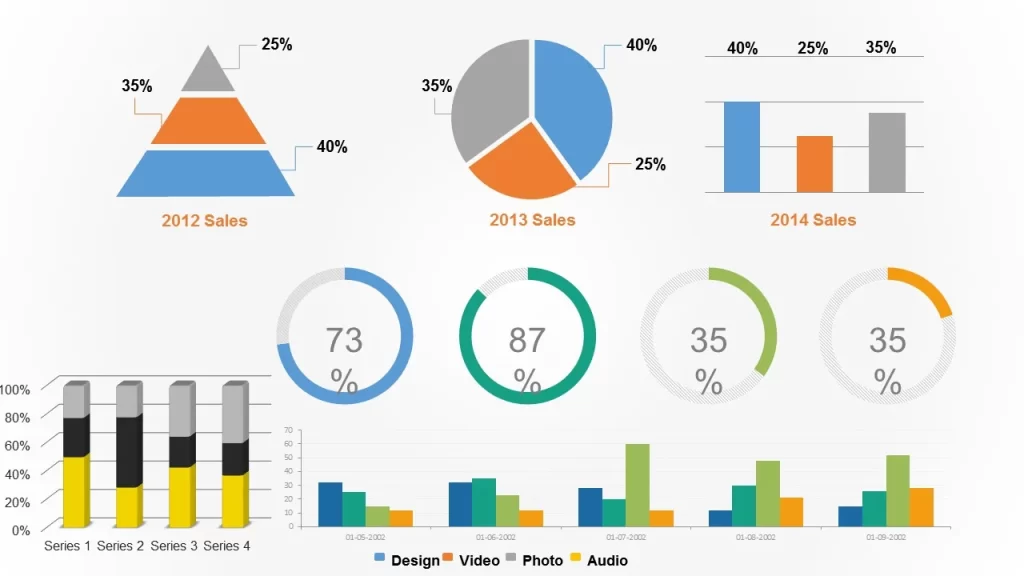
A good visualization tells a story, removing the noise from data and highlighting useful information, curating data into a form easier to understand, and highlighting the trends and outliers.
Advanced Data Analytics and Visualization course using Microsoft Excel, helps build complex models, making it easy to reach meaningful conclusions, and simplifies the decision-making process.
Companies can then use these insights to identify areas to improve upon and factors that influence customer satisfaction and make better predictions for sales and growth.
Data storytelling helps the data feel alive and ensures that the message it’s conveying is meaningful and relevant, by balancing logic and facts with the emotional impact of a story, companies can better engage their audiences and enhance interactions with their customer base during business events.
By the end of this practical business intelligence with Excel course, you will be able to apply advanced data analytics and data visualization techniques to identify underlying trends and patterns in data with Microsoft Excel.

Learning Data Science, Data Visualisation & Data Analysis are critical skills in gaining a deeper understanding of your data and making better decisions. They help in analyzing the performance of the business & continuous improvement of processes.
This course covers a number of Statistical Data Analysis Techniques for Predictive Analytics, Data Mining, Advanced Data Visualization Techniques & much more… all using Microsoft Excel. Each method is demonstrated with examples & exercises for your own business analytics.
This is the highest level of Microsoft Excel MasterClass to learn advanced Data visualization & Business Analytics.
Classroom-based lectures with hands-on exercises on analyzing data using Microsoft Excel are used in this workshop to analyze & visualize data and find meaningful information. Data and business analytics provide valuable insights to management.
Advanced Data Analytics & Data Visualization Course With Excel
Course Outline
This is a very practical, hands-on, and insightful course, full of advanced Excel techniques to bring in the data, analyze it quickly, identify trends, and visualize the information in charts, graphs and dashboards.

Module 1: Data Modeling Using Pivot Tables & Pivot Charts
- Introduction to Data Modeling
- Data Filtering & Transformation
- Use Pivots to identify patterns across multiple data sets
- Visual Analysis with Pivot Charts
Module 2: Solver and Scenarios to Manage Multiple Constraints
- Managing Multiple Constraints
- Proof of concept using Data Solver
- Decision Making using Scenarios
Module 3: Data Modeling & Linear Regression for Better Forecasts
- Data Modeling Principles
- Building a Model With Excel
- Using Linear Regression
Module 4: Data Mining and Goal Seek To Derive Business Insights
- Data Mining With Lookup Functions
- Business Insights From Goal Seek
- Advanced Use Cases for Data Mining With Excel Functions
Module 5: Statistical Analysis and Data Visualization Dashboards
- Key Principles of Data Visualization
- Presentation of qualitative data-driven visualization
- Statistical analysis of data
Learn The Secrets of Data Analysis With Excel Today in Singapore.
Join This Practical Training
To Get Ahead With Advanced
Business Data Analysis & Visualization.

Learn The Best Excel Functions & Features for Data Analytics!
Business Data Analytics With Excel Course Trainer:

This Excel Data Analysis course is created and delivered by Vinai Prakash, Master Trainer & Founder of Intellisoft Systems.
Vinai has authored several articles on Data Analysis, Excel Dashboarding Techniques, Data Warehousing, Data Mining, Using SQL Databases for Creating Data-Rich applications, published in leading magazines, newspapers & books.
Click Here to Download The 8 Habits of Highly Effective Data Analystshttps://intellisoft.leadpages.co/leadbox-1474056818.js(An article written by Vinai Prakash, published in The Straits Times Newspaper in Singapore)
 Most data analysts, managers, decision-makers, and even end users typically struggle with report creation as they lack knowledge of features such as data analysis, data cleanup, advanced pivot tables techniques, and visualization techniques within Excel.
With this WSQ course, we target such people and will help such people learn advanced data analytic and data visualization techniques to organize data better and represent the same in both a dynamic tabular and chart format.
After attending this WSQ Advanced Excel Data Analytics & Visualization course, our audience will be better able to:
- Organize data within excel in a “normalized” way to create dynamic reports.
- Create Pivot tables and charts that provide a dynamic view of data based on slider selections.
- Create infographics summaries that are linked to the analyzed data and Pivot tables.

ACTA Certified Trainers

Authorized Training Organization

WSQ
Certifications
Fully Set Up
Training Room

20+ Years
Experience in Education

Practical, Hands-on
Training

25,000+
Certified Students

32+
Courses

Useful & Handy
Student Guide