
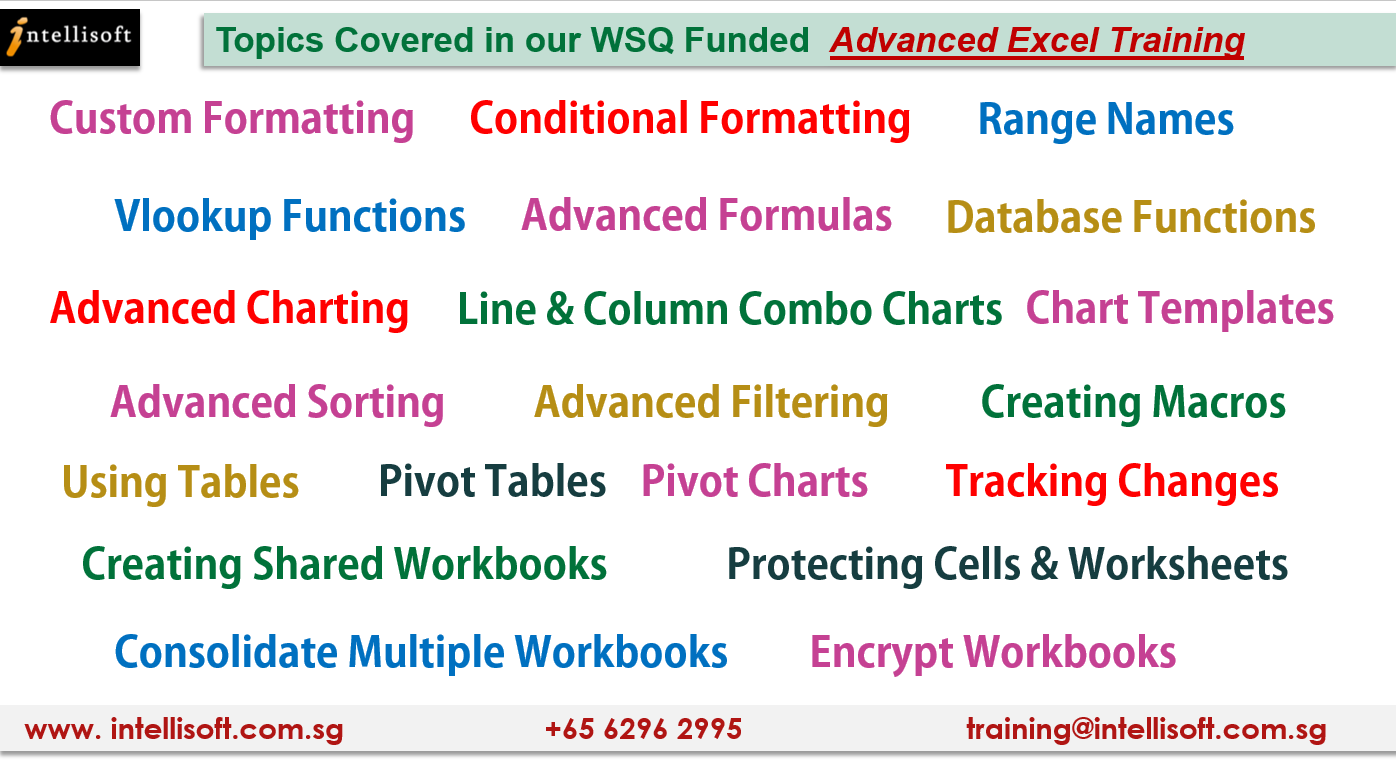
Join WSQ Funded Microsoft Excel Advanced Course in Singapore.
Most people are looking for WSQ Advanced Excel Courses – Where they can learn about the most important and useful features of Microsoft Excel (Pivot Tables, Creating Macros, Using Vlookup & other Advanced Functions in Excel).
Often people know the basics of Excel: doing data entry, copying and pasting values, dragging formulas down, and opening, and saving files. However, that’s about all they know in Excel. This is such a sad thing, as they remain completely unaware of the real power of Microsoft Excel.
Learn Advanced Excel Training Singapore with WSQ Grant
Why is there such a lack of good Advanced Excel Skills in Singapore?
Well, most people only learn the basics of how to key in the data, and add a couple of numbers, but never go beyond that.
Microsoft has now actually expanded the ribbon and added more buttons in the Home tab in the hope that people will find it easier to pick up the goodies – Sorting, Filtering, AutoSum, Conditional Formatting and Tables easily.
So how come most people miss these buttons are remain completely oblivious of the hidden power of Microsoft Excel?
All I can say is that it is partly because of Microsoft – they add a lot of features, but don’t take the time to educate the market about these fantastic features in Excel. After all, they are a software company, not an Education company.
So they leave it to Educational institutes, and the likes of YouTube for people to turn to, and pick up the knowledge required to use these advanced functions and features of Microsoft Excel.
So What Does It Take For Advanced Excel Training?
It’s simple.
- Interest,
- Curiosity,
- Willingness to learn something new, and
- A burning desire to stay at it until you master the Advanced Excel Functions & Features.
You initially need to master how to summarize a huge amount of data using Pivot Tables, Record Macros to Automate the routine stuff, and Build Formulas using Advanced Functions like VLookup, SUMIF, INDEX, MATCH, OFFSET, IF, AND, OR, XLookup, Text Cleanup Functions, Statistical Functions, Financial Functions.
Once you have reached this important milestone in your education, then you can see and feel the real beauty of Microsoft Excel.
It seems a magical tool that can perform advanced spreadsheet tasks like transforming dirty data into neat and clean, organized data ready for reporting, ready for consumption, and ready for detailed analysis to find the real insights in your data.
Key Features of Advanced Excel That You Must Know
You have to build a deep knowledge of some key functions of Microsoft Excel introduced in the past few years.
Must-Know Functions of Microsoft Excel
Financial Functions like NPV, PMT, and FV help us calculate the Net Present Value, Future Value, and Monthly Installment easily.
Statistical Functions like Correlation, Regression, Mean, Median, Mode, Standard Deviation, and Variance are easy to calculate to perform descriptive data analysis.
Logical Functions like If, Sumif, Countif, OR, AND, IFS, and SUMIFS help to compute things conditionally.
Lookup Functions are aplenty in Excel. Advanced Excel Training is often covering VLookup, and HLookup. Our Data Interpretation & Analysis Training also covers INDEX, MATCH, and OFFSET functions – the holy grail of Array functions in Excel.
Mastering these array functions takes your Advanced Excel skills even higher!
Pivot Tables To Summarize Data Quickly
Pivot Tables allow you to quickly group data by any dimension – By Country, division, geography, product, by years, quarters, months etc.
And you can view the sum, count, average, minimum or maximum value by any dimension.
All this is without writing a single line of code, or a single function. In fact, all this grouping and

summarization can be done simply by using the mouse, without ever touching the keyboard.
With such amazing features, Pivot Tables are one of the Most Loved Features of Microsoft Excel.
Almost every Advanced Excel Course in Singapore would cover Pivot Tables. Of course, there are so many hidden features in Pivot Tables, that most training programs fall short of covering them well.
At Intellisoft Training, our Advanced Excel Certification Training covers all the key features in great detail.
In fact, we spend over 3-4 hours in class, going through each and every Pivot Table functionality, step by step, until everyone gets it, and has tried them on their own, on the sample exercise files provided.
Sharing & Protecting Data With Microsoft Excel Advanced Feature Set
Excel files are shared with colleagues, clients, partners and almost everyone looking for reports, templates or quick solutions.
While sharing Excel files is easy, it comes with a big risk. You need to embed all the data and it is often easy to pick up price lists, costs, budgets and all kinds of sensitive data that you would like to avoid from prying eyes.
Fortunately, Excel has a variety of features that can allow you to protect the data, or selectively make it viewable by people who have the correct password.
This way, you can avoid losing your sensitive data from competitors or colleagues, and yet, share it with the people who need it.
Advanced Excel settings even allow separate passwords to open or modify the file.
Protection can also be done to an individual cell or a cell range too. With cell-level protection, it is good to protect your data and share it selectively.
Conditional Formatting With Advanced Excel Training Courses
It is often difficult to pick any trend, spot duplicate values, or find out which cells do not meet the validation criteria specified.
Spotting wrong Country codes, Gost centre codes, Departments, Products, or any kind of values is a breeze with an Advanced Feature in Microsoft Excel.
Even though Conditional Formatting has been around for over 15+ years, most people do not use it at all or do not use it efficiently.
When used effectively, Conditional Formatting can be a lifesaver, allowing you to spot duplicates, find invalid values, or detect anomalies in data quickly. With colour coding, it is even possible to have multiple rules running on the same data set.
Excel Validation Rules can be enabled or disabled, and modified at any time.
With such amazing functionality built within Excel, you just have to set up the rules once, and then Excel will remember them forever… waiting for any erroneous data to happen so that the rules can catch it, and alert you.
Conditional Formatting combined with Data Validation Rules in Excel can make the rules very strict or use them as a Warning only.
The Conditional Formatting feature of our Advanced Excel Courses in Singapore has been a sellout.
Even when I conduct Microsoft Excel classes online for overseas clients using Microsoft Teams or Zoom, I am amazed that the requirements are pretty much the same the whole world.
Everywhere I go, people love the Conditional Formatting ability of Excel. Many even ask if it is a new feature of Microsoft Office 365, but are surprised to find out that it has been around for ages!
Use Macros To Automate Common Steps within Microsoft Excel
Every month I get some raw data in CSV Files from our ERP System – SAP. There are several files, consisting of product codes, pricelists, sales, inventory position etc.
Now SAP provides a plethora of reports, but yet, I sometimes need to drill deeper, and for this, I need the raw data directly from SAP. After several failed requests, finally, the IT guys relented when the Country Manager put pressure on them to provide the raw data.
However, the raw data was delivered in separate files, and it is a mess to clean it up, load it, and pick the things that I need. Often times I have to do a hell lot of manual steps, involving 3-4 hours of careful, painstaking work before I can even get the correct data.

Then I need to do this for multiple raw files, load them together into a data model, and then query it using Lookup tables, before merging it into a huge mega table.
By this time, the data file has become quite huge, and the pivot tables and deeper drill down become a chore.
However, many a time, we have been able to get to the root cause of the issue by digging deeper and thus, we endure this painful process time and time again.
Fortunately, several years back, someone introduced me to Excel Macros – Small pieces of steps that I could record, and play again very quickly.
Initially, small steps did not save too much time, but they were a nice thing to record, execute, and amaze my colleagues and boss.
However, I started to build small steps and then combined them to form a larger set of steps. Combined, they began to help me clean the data, remove the rows I did not want, and do the correct lookups. In small steps, I began saving time.
Over the months, the scripts started becoming better and better, and finally, today, I can run a master macro that combines all the files, pick, sifts and cleans them up.
Then the data model is updated, and the pivots and other charts and reports are generated. All this happens automagically, and it takes only about 8 to 10 minutes, a mere fraction of the time I used to spend manually, month after month.
Learning to Record Excel Macros, and combining them to create magic has been the single most useful thing for me.
Macros are written in a specific language – VBA, which is a full language in itself and takes time to learn. However, simple macros that can be recorded on the fly are still a thing of beauty and a great time saver.
If you haven’t started using Macros yet, now is the time to get introduced to the power of Excel Macros. It is an essential and much loved feature of our Advanced Excel Training course.
Charting Bonanza in Excel
A management dashboard entirely composed of Excel Charts is not a common sight. But when it is shown to the management, they are completely blown away. That’s because most of the time, people keep showing detailed data, pivot tables, and data in Tables upon tables.
Huge tables spanning entire screens, with the small ant-sized font to squeeze in every single detail are a bane of the managers and decision-makers.
A graphical representation, a picture, a chart can say the same thing, in less space, and in a better way, provided you use the Advanced Charting Features of Microsoft Excel well.
Excel can create 2 Axis Charts, Pareto Charts, Pie Charts, Area Charts, Waterfall charts, Radar charts and so much more. Yet, the Bar chart is the most popular chart when used, probably because it is the default chart in Excel.
Bar or Pie, it is important to use charts to quickly highlight the key numbers to your clients, making them easier to understand and easier to realize the issues, so that better decision making can happen. That’s the whole purpose of displaying reports in Charts to them in the first place.
Advanced settings for Vertical Axis, Chart Title, Value Axis, Combination Charts, Cumulative Charts, and Hi-Lo Charts plus some manual intervention can work wonders in highlighting the key essence in a single visual.
Combining Multiple Worksheets & Workbooks
Data in a single worksheet or a single workbook is fine. But many reports require us to combine data from multiple sheets. So if you have the monthly data for each month in a separate sheet, you’ll have 12 sheets for the 12 months. Which is fine if you want to look at a month at a time. But what if you want to analyze data by quarters, or by the different months in a single report. This would mean you have to combine the data. Doing it manually is very repetitive, cumbersome proneness and is prone to errors.
Fortunately Excel has native capability to combine data from multiple worksheets and workbooks that is mostly unknown to even several Excel gurus.
In our Advanced Excel Training, we go through 3 different techniques to combine data from multiple sources, sheets, workbooks easily, and do in such a way that next month, the data can refresh automatically too.
Learn Advanced Excel Training in Singapore with up to 90% WSQ Grant
Learn how to combine data in Excel easily in our 3 Day Advanced Excel Training.
Learn Advanced Excel Training in Singapore with WSQ Grant
By now I hope you are completely sold to the multiple benefits of learning Advanced Excel. So what are you waiting for?
Join us for 3 days, Weekdays or Weekends, in class, or virtually, over Zoom, to learn directly from me, step by step, using sample files, multiple examples, step by step guidelines provided to you.
The Singapore government is even funding the training for Singaporeans and PRs. Whether you are company sponsored, or coming on your own, you can tap on the government grants from SSG. For the balance portion, you can use your SkillsFuture credits, if applicable.
Need Microsoft Office License or Trial?
Contact Us for Further Enquiries related to Courses.
Learn Advanced Excel Training in Singapore with up to 90% WSQ Grant
Register for WSQ Advanced Excel Training in Singapore or Online Excel Training Anywhere at Intellisoft